Delete, move or append one or more layers in a ggplot object.
Usage
delete_layers(x, match_type = NULL, idx = NULL)

append_layers(x, object, position = "top")

move_layers(x, match_type = NULL, position = "top", idx = NULL)

shift_layers(x, match_type = NULL, idx = NULL, shift = 1L)

which_layers(x, match_type = NULL, idx = NULL)

extract_layers(x, match_type = NULL, idx = NULL)

top_layer(x)

bottom_layer(x)

num_layers(x)
Arguments
- x
an object of class
ggto be operated upon.- match_type
The name of the ggproto object class for the geom(s), position(s) or stat(s) matching that of the layers to be operated upon.
- idx
integer vector Index into the list of layers used to select the layers to be operated upon.
- object
a ggplot layer created by a
geom_orstat_function or a list of such layers or an empty list.- position
character or interger, the position of the layer immediately above of which to move or append the moved or appended layers.
- shift
integer.
Value
An edited copy of x for delete_layers,
append_layers and move_layers. An integer vector of indexes
giving the positions of the matching layers in the list of layers contained
in x in the case of which_layers.
Details
These functions must be used with care as they select all layers matching the provided geom, position or stat ggproto object class. Layers added with a stat do use a geom, and vice versa.
One and only one of match_type and idx must be passed a
non-null argument.
In plots with several layers, it is possible that more than one layer
matches the class name passed to match_type. It is also possible to
pass a numeric vector with multiple indexes through parameter idx.
In both cases multiple layers will be operated upon, but their relative
positions will remain unchanged.
If a numeric vector with multiple position indexes is supplied as argument
for position, the topmost position will be used. As indexing in R
starts at 1, passing 0 or "bottom" as argument for position
puts the moved or appended layer(s) behind all other layers (prepends the
layer).
Note
The functions described here are not expected to be useful in everyday plotting as one can more easily change the order in which layers are added to a ggplot. However, if one uses high level methods or functions that automatically produce a full plot using 'ggplot2' internally, one may need to add, move or delete layers so as to profit from such canned methods and retain enough flexibility.
Examples
df <- data.frame(
  gp = factor(rep(letters[1:3], each = 10)),
  y = rnorm(30)
)
p <- ggplot(df, aes(gp, y)) +
       geom_point() +
       stat_summary(fun.data = "mean_se", colour = "red")
p

delete_layers(p, "GeomPoint")

delete_layers(p, "StatSummary")

move_layers(p, "GeomPoint", position = "top")

move_layers(p, "GeomPointrange", position = "bottom")

move_layers(p, "StatSummary", position = "bottom")

move_layers(p, "GeomPointrange", position = 1L)

append_layers(p, geom_line(colour = "orange"), position = "bottom")

append_layers(p, geom_line(colour = "orange"), position = 1L)

extract_layers(p, "GeomPoint")
#> $geom_point
#> geom_point: na.rm = FALSE
#> stat_identity: na.rm = FALSE
#> position_identity
#>
ggplot(df, aes(gp, y)) + extract_layers(p, "GeomPoint")

which_layers(p, "GeomPoint")
#> geom_point
#>          1
num_layers(p)
#> [1] 2
top_layer(p)
#> [1] 2
bottom_layer(p)
#> [1] 1
num_layers(ggplot())
#> [1] 0
top_layer(ggplot())
#> [1] NA
bottom_layer(ggplot())
#> [1] NA

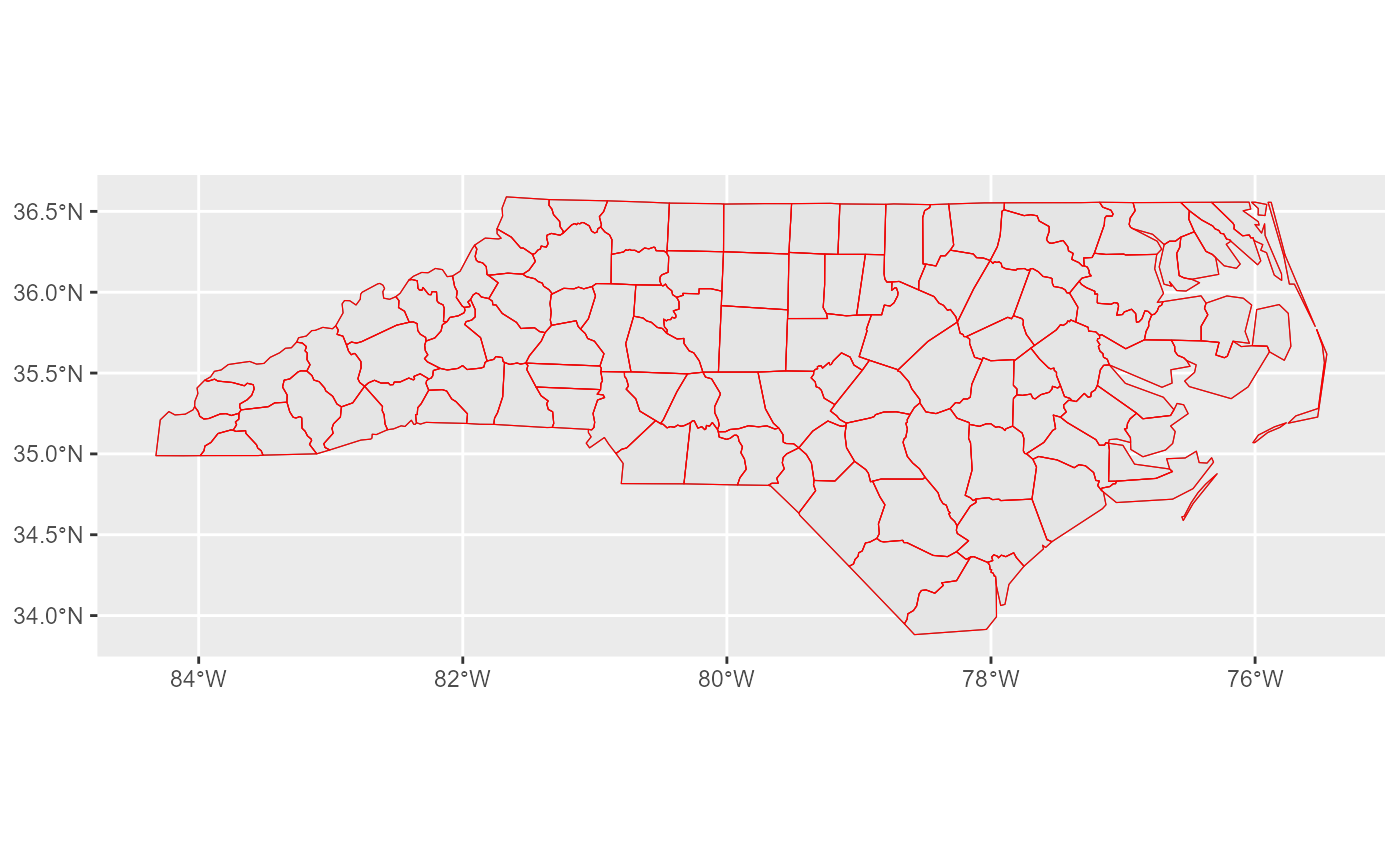
if (requireNamespace("sf", quietly = TRUE)) {
  nc <- sf::st_read(system.file("shape/nc.shp", package = "sf"), quiet = TRUE)
  nc_3857 <- sf::st_transform(nc, 3857)

  p.sf1 <- ggplot() +
           geom_sf(data = nc)
  print(p.sf1)
  num_layers(p.sf1)
  top_layer(p.sf1)

  p.sf1app <-
  append_layers(p.sf1,
                geom_sf(data = nc_3857, colour = "red", fill = NA),
                position = "top")
  print(p.sf1app)

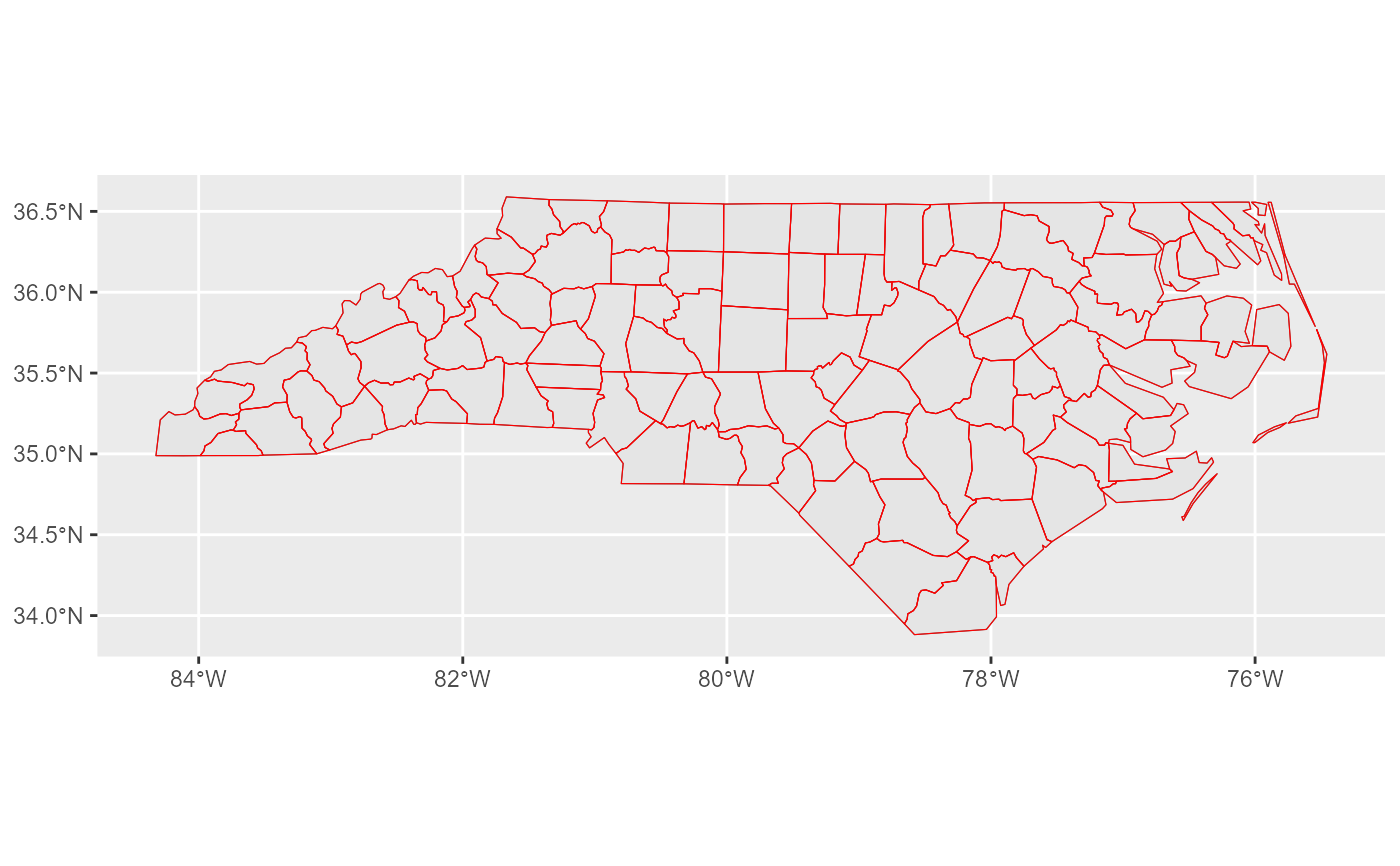
  p.sf2 <- ggplot() +
           geom_sf(data = nc) +
           geom_sf(data = nc_3857, colour = "red", fill = NA)
  print(p.sf2)
  num_layers(p.sf2)
  top_layer(p.sf2)
  delete_layers(p.sf2, idx = 2L)

  extract_layers(p.sf2, "GeomSf")
  extract_layers(p.sf2, "StatSf")
  extract_layers(p.sf2, idx = 1L)

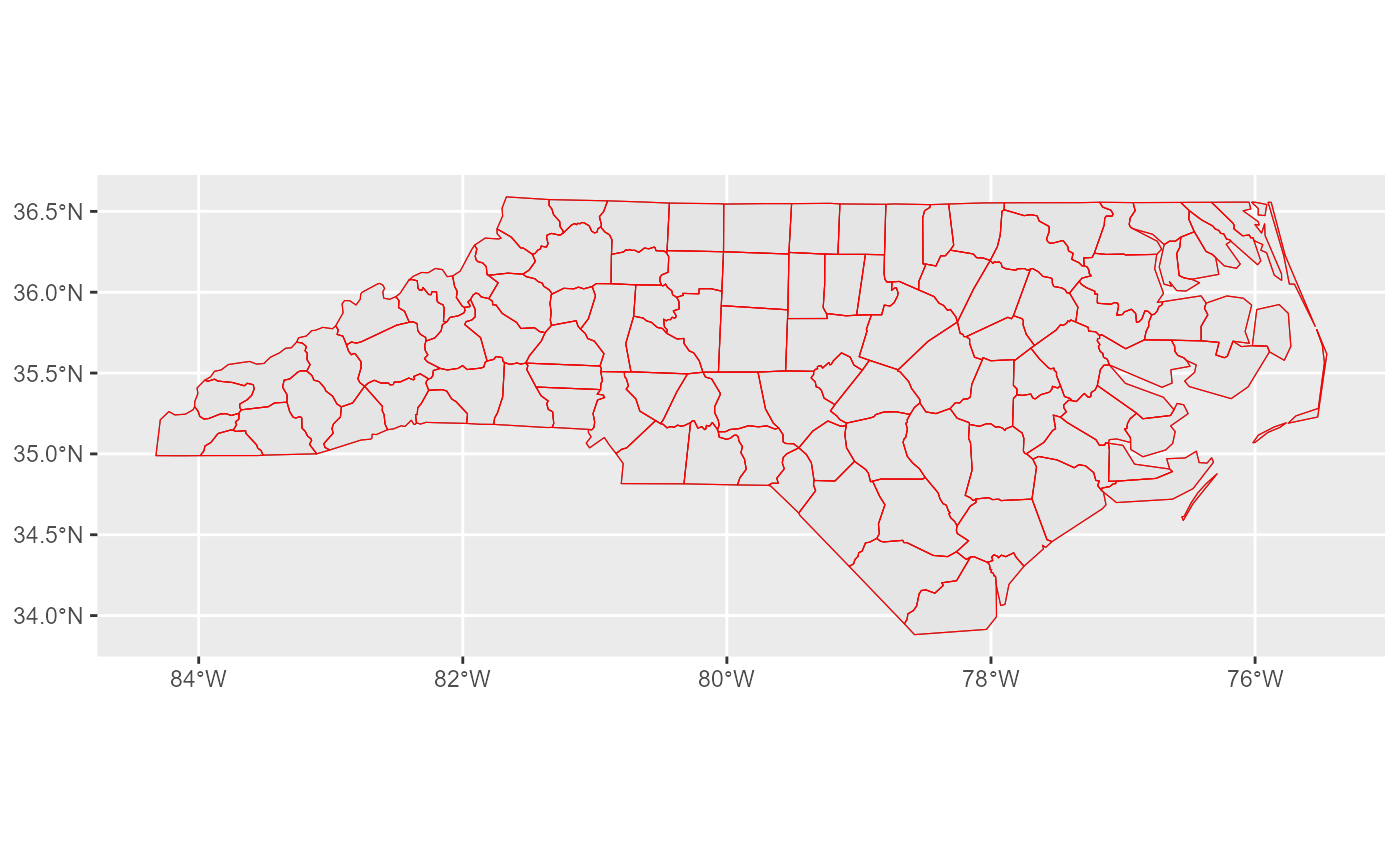
  p.sf3 <- p.sf1 + extract_layers(p.sf2, idx = 2L)
  print(p.sf3)

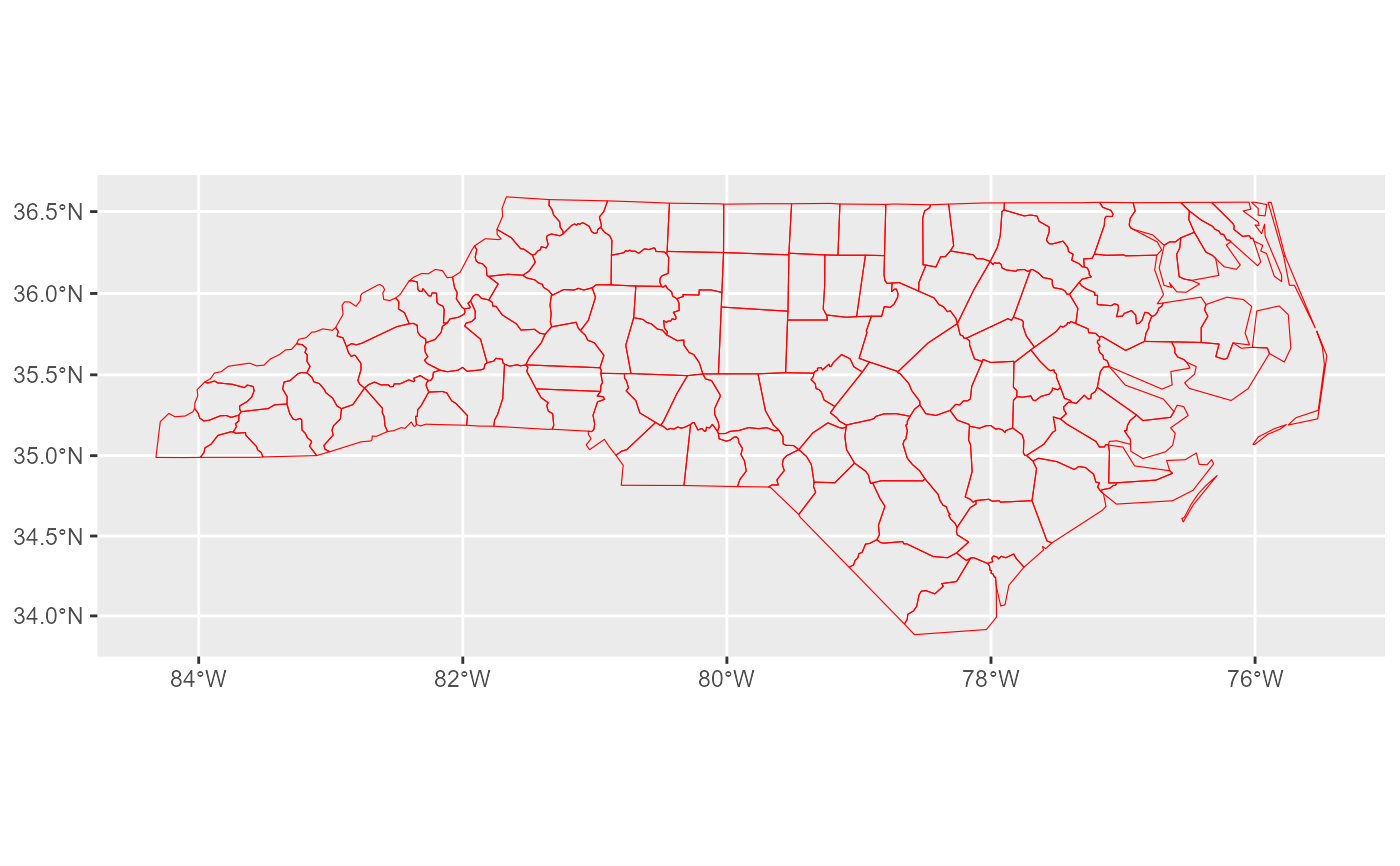
  # beware that Coords are not extracted!

  p.sf4 <- ggplot() + extract_layers(p.sf2, idx = 2L) + coord_sf()
  print(p.sf4)
}


