Label pairwise comparisons
Source:R/geom-label-pairwise.r, R/geom-text-pairwise.R
geom_text_pairwise.RdAdd a plot layer with a text label and a segment connecting two
values along the x aesthetic. These are usually two levels of a
factor mapped to the x aesthetic when used to report significance or
highlighting pairwise comparisons.
Usage
geom_label_pairwise(
  mapping = NULL,
  data = NULL,
  stat = "identity",
  position = "identity",
  ...,
  orientation = NA,
  parse = FALSE,
  nudge_x = 0,
  nudge_y = 0,
  default.colour = NULL,
  default.color = default.colour,
  colour.target = "all",
  color.target = colour.target,
  default.alpha = NA,
  alpha.target = "segment",
  label.padding = grid::unit(0.25, "lines"),
  label.r = grid::unit(0.15, "lines"),
  segment.linewidth = 0.5,
  arrow = NULL,
  size.unit = "mm",
  na.rm = FALSE,
  show.legend = FALSE,
  inherit.aes = FALSE
)

geom_text_pairwise(
  mapping = NULL,
  data = NULL,
  stat = "identity",
  position = "identity",
  ...,
  orientation = NA,
  parse = FALSE,
  nudge_x = 0,
  nudge_y = 0,
  default.colour = "black",
  default.color = default.colour,
  colour.target = "all",
  color.target = colour.target,
  default.alpha = NA,
  alpha.target = "all",
  segment.linewidth = 0.5,
  arrow = NULL,
  check_overlap = FALSE,
  size.unit = "mm",
  na.rm = FALSE,
  show.legend = NA,
  inherit.aes = FALSE
)
Arguments
- mapping
Set of aesthetic mappings created by
aes. Withinherit.aes = FALSE(the default) it is not combined with the default mapping at the top level of the plot. You always need to supply amappingunless you setinherit.aes = TRUE.- data
A data frame. If specified, overrides the default data frame defined at the top level of the plot.
- stat
The statistical transformation to use on the data for this layer, as a string.
- position
Position adjustment, either as a string, or the result of a call to a position adjustment function.
- ...
other arguments passed on to
layer. There are three types of arguments you can use here:Aesthetics: to set an aesthetic to a fixed value, like
colour = "red"orsize = 3.Other arguments to the layer, for example you override the default
statassociated with the layer.Other arguments passed on to the stat.
- orientation
character The orientation of the layer. The default (
NA) automatically determines the orientation from the aesthetic mapping. In the rare event that this fails it can be given explicitly by setting orientation to either "x" or "y".- parse
If
TRUE, the labels will be parsed into expressions and displayed as described in?plotmath.- nudge_x, nudge_y
Horizontal and vertical adjustments to nudge the starting position of each text label. The units for
nudge_xandnudge_yare the same as for the data units on the x-axis and y-axis.- default.colour, default.color
A colour definition to use for elements not targeted by the colour aesthetic.
- colour.target, color.target
A vector of character strings;
"all","text","segment","box","box.line", and"box.fill"or"none".- default.alpha
numeric in [0..1] A transparency value to use for elements not targeted by the alpha aesthetic.
- alpha.target
A vector of character strings;
"all","text","segment","box","box.line", and"box.fill"or"none".- label.padding
Amount of padding around label. Defaults to 0.25 lines.
- label.r
Radius of rounded corners. Defaults to 0.15 lines.
- segment.linewidth
numeric Width of the segments or arrows in mm.
- arrow
specification for arrow heads, as created by
arrow- size.unit
How the `size` aesthetic is interpreted: as millimetres (`"mm"`, default), points (`"pt"`), centimetres (`"cm"`), inches (`"in"`), or picas (`"pc"`).
- na.rm
If
FALSE(the default), removes missing values with a warning. IfTRUEsilently removes missing values.- show.legend
logical. Should this layer be included in the legends?
NAincludes a legend if any aesthetics are mapped.FALSE, the default, never includes it, andTRUEalways includes it.- inherit.aes
If
FALSE, overrides the default aesthetics, rather than combining them.- check_overlap
If
TRUE, text that overlaps previous text in the same layer will not be plotted.check_overlaptakes place at draw time and in the order of the data, thus its action depends of the size at which the plot is drawn.
Details
Geometries geom_text_pairwise() and
geom_label_pairwise() have an interface similar to that of
geom_text and geom_label, but
add a segment connecting two values along x. In the most
frequent use case they add a segment connecting pairs of levels from a
grouping factor mapped to the x or y aesthetic. They can
also be used to label ranges of values.
The segment extends from xmin to xmax, and the text label is
located at x with a default that positions the label at the centre
of the bar. The ends of the bar can be terminated with arrow heads given
by parameter arrow, with a default of a plain segment without
arrow tips. The text label is located slightly above the segment by the
default value of vjust in geom_text_pairwise() and on top
of the segment in geom_label_pairwise().
Layer functions geom_text_pairwise() and
geom_label_pairwise() use by default
position_nudge. Nudging affects both text label and
bar, and its default of no displacement will very rarely need to be
changed.
Differently to geom_text_repel() and geom_label_repel(),
geom_text_pairwise() and geom_label_pairwise() do not make
use of additional aesthetics for the segments or boxes, but instead allow
the choice of which elements are targeted by the usual 'ggplot2' aesthetics
and which are rendered using a default constant value. In the grammar of
graphics using the same aesthetic with multiple meanings is not allowed,
thus, the approach used in package 'ggpp' attempts to enforce this.
Under development!
This geometry is still under development and its user interface subject to change.
Plot boundaries and clipping
Note that when you change the scale
limits for x and/or y of a plot, text labels stay the same
size, as determined by the size aesthetic, given in millimetres. The
actual size as seen in the plotted output is decided during the rendering
of the plot to a graphics device. Limits are expanded only to include the
anchor point of the labels because the "width" and "height" of a text
element are 0 (as seen by ggplot2). Text labels do have height and width,
but in grid units, not data units. Either function
expand_limits or the scale expansion can be used to
ensure text labels remain within the plotting area.
Alignment
You can modify text alignment with the vjust and
hjust aesthetics. These can either be a number between 0
(right/bottom) and 1 (top/left) or a character ("left",
"middle", "right", "bottom", "center",
"top"). Values outside the range 0..1 displace the text label so
that the anchor point is outside the text label. In addition, you can use
special alignments for justification including "position",
"inward" and "outward". Inward always aligns text towards the
center of the plotting area, and outward aligns it away from the center of
the plotting area. If tagged with _mean or _median (e.g.,
"outward_mean") the mean or median of the data in the panel along
the corresponding axis is used as center. If the characters following the
underscore represent a number (e.g., "outward_10.5") the reference
point will be this value in data units. Position justification is computed
based on the direction of the displacement of the position of the label so
that each individual text or label is justified outwards from its original
position. The default justification is "identity".
Aesthetics
Layer functions geom_text_pairwise() and
geom_label_pairwise() require aesthetics xmin, xmax,
x, y and
label and support aesthetics: alpha, colour,
group, size (of text), family, fontface,
linewidth, linetype, hjust and vjust. In addition,
geom_text_pairwise supports angle and geom_label_pairwise supports
fill. See
aes_colour_fill_alpha,
aes_linetype_size_shape,
aes_position, and
aes_group_order.
In 'ggplot2' linewidth when applied to the border of the box drawn
by geom_label() is given in points rather than in mm because of a
historical error in the code. In other geometries such as
geom_segment() linewidth is given in mm. As in
geom_label_pairwise() it is important to remain consistent among
different linewidth specifications, mm are used both for the box
border and linking segment. To imitate the behaviour of geom_label()
a correction factor of 0.75 (more exactly 1 pt = 0.7528 mm) can be used for
the line width of the border of the box.
See also
geom_text_s, geom_label_s,
geom_text, geom_label and
other documentation of package 'ggplot2'.
Examples
my.cars <- mtcars
my.cars$name <- rownames(my.cars)
p1 <- ggplot(my.cars, aes(x = factor(cyl), y = mpg)) +
geom_boxplot(width = 0.33)
# With a factor mapped to x, highlight pairs
my.pairs <-
data.frame(A = 1:2, B = 2:3, bar.height = c(12, 30),
p.value = c(0.01, 0.05678))
p1 +
geom_text_pairwise(data = my.pairs,
aes(xmin = A, xmax = B,
y = bar.height,
label = p.value),
parse = TRUE)
 p1 +
geom_text_pairwise(data = my.pairs,
aes(xmin = A, xmax = B,
y = bar.height,
label = sprintf("italic(P)~`=`~%.2f", p.value)),
arrow = grid::arrow(angle = 90,
length = unit(1, "mm"),
ends = "both"),
parse = TRUE)
p1 +
geom_text_pairwise(data = my.pairs,
aes(xmin = A, xmax = B,
y = bar.height,
label = sprintf("italic(P)~`=`~%.2f", p.value)),
arrow = grid::arrow(angle = 90,
length = unit(1, "mm"),
ends = "both"),
parse = TRUE)
 p1 +
geom_text_pairwise(data = my.pairs,
aes(xmin = A, xmax = B,
y = bar.height,
label = sprintf("italic(P)~`=`~%.2f", p.value)),
colour = "red",
arrow = grid::arrow(angle = 90,
length = unit(1, "mm"),
ends = "both"),
parse = TRUE)
p1 +
geom_text_pairwise(data = my.pairs,
aes(xmin = A, xmax = B,
y = bar.height,
label = sprintf("italic(P)~`=`~%.2f", p.value)),
colour = "red",
arrow = grid::arrow(angle = 90,
length = unit(1, "mm"),
ends = "both"),
parse = TRUE)
 p1 +
geom_label_pairwise(data = my.pairs,
aes(xmin = A, xmax = B,
y = bar.height,
label = sprintf("italic(P)~`=`~%.2f", p.value)),
colour = "red", size = 2.75,
arrow = grid::arrow(angle = 30,
length = unit(1.5, "mm"),
ends = "both"),
parse = TRUE)
p1 +
geom_label_pairwise(data = my.pairs,
aes(xmin = A, xmax = B,
y = bar.height,
label = sprintf("italic(P)~`=`~%.2f", p.value)),
colour = "red", size = 2.75,
arrow = grid::arrow(angle = 30,
length = unit(1.5, "mm"),
ends = "both"),
parse = TRUE)
 p1 +
geom_text_pairwise(data = my.pairs,
aes(xmin = A, xmax = B,
y = bar.height,
label = sprintf("italic(P)~`=`~%.2f", p.value)),
colour = "red", colour.target = "segment",
arrow = grid::arrow(angle = 90,
length = unit(1, "mm"),
ends = "both"),
parse = TRUE)
p1 +
geom_text_pairwise(data = my.pairs,
aes(xmin = A, xmax = B,
y = bar.height,
label = sprintf("italic(P)~`=`~%.2f", p.value)),
colour = "red", colour.target = "segment",
arrow = grid::arrow(angle = 90,
length = unit(1, "mm"),
ends = "both"),
parse = TRUE)
 p1 +
geom_text_pairwise(data = my.pairs,
aes(xmin = A, xmax = B,
y = bar.height,
label = sprintf("italic(P)~`=`~%.2f", p.value)),
colour = "red", colour.target = "text",
arrow = grid::arrow(angle = 90,
length = unit(1, "mm"),
ends = "both"),
parse = TRUE)
p1 +
geom_text_pairwise(data = my.pairs,
aes(xmin = A, xmax = B,
y = bar.height,
label = sprintf("italic(P)~`=`~%.2f", p.value)),
colour = "red", colour.target = "text",
arrow = grid::arrow(angle = 90,
length = unit(1, "mm"),
ends = "both"),
parse = TRUE)
 # with a numeric vector mapped to x, indicate range
p2 <-
ggplot(my.cars, aes(disp, mpg)) +
geom_point()
my.ranges <-
data.frame(A = c(50, 400),
B = c(200, 500),
bar.height = 5,
text = c("small", "large"))
p2 +
geom_text_pairwise(data = my.ranges,
aes(xmin = A, xmax = B,
y = bar.height, label = text))
# with a numeric vector mapped to x, indicate range
p2 <-
ggplot(my.cars, aes(disp, mpg)) +
geom_point()
my.ranges <-
data.frame(A = c(50, 400),
B = c(200, 500),
bar.height = 5,
text = c("small", "large"))
p2 +
geom_text_pairwise(data = my.ranges,
aes(xmin = A, xmax = B,
y = bar.height, label = text))
 p2 +
geom_text_pairwise(data = my.ranges,
aes(xmin = A, xmax = B,
y = bar.height, label = text),
angle = 90, hjust = -0.1)
p2 +
geom_text_pairwise(data = my.ranges,
aes(xmin = A, xmax = B,
y = bar.height, label = text),
angle = 90, hjust = -0.1)
 p2 +
geom_label_pairwise(data = my.ranges,
aes(xmin = A, xmax = B,
y = bar.height, label = text),
angle = 90, hjust = -0.1)
p2 +
geom_label_pairwise(data = my.ranges,
aes(xmin = A, xmax = B,
y = bar.height, label = text),
angle = 90, hjust = -0.1)
 p2 +
geom_label_pairwise(data = my.ranges,
aes(xmin = A, xmax = B,
y = bar.height, label = text))
p2 +
geom_label_pairwise(data = my.ranges,
aes(xmin = A, xmax = B,
y = bar.height, label = text))
 p2 +
geom_text_pairwise(data = my.ranges,
aes(xmin = A, xmax = B,
y = bar.height, label = text),
arrow = grid::arrow(ends = "both", length = unit(2, "mm")))
p2 +
geom_text_pairwise(data = my.ranges,
aes(xmin = A, xmax = B,
y = bar.height, label = text),
arrow = grid::arrow(ends = "both", length = unit(2, "mm")))
 # implicit orientation = "y"
p3 <- ggplot(my.cars, aes(x = mpg, y = factor(cyl))) +
geom_boxplot(width = 0.33)
p3 +
geom_text_pairwise(data = my.pairs,
aes(ymin = A, ymax = B,
x = bar.height,
label = p.value))
# implicit orientation = "y"
p3 <- ggplot(my.cars, aes(x = mpg, y = factor(cyl))) +
geom_boxplot(width = 0.33)
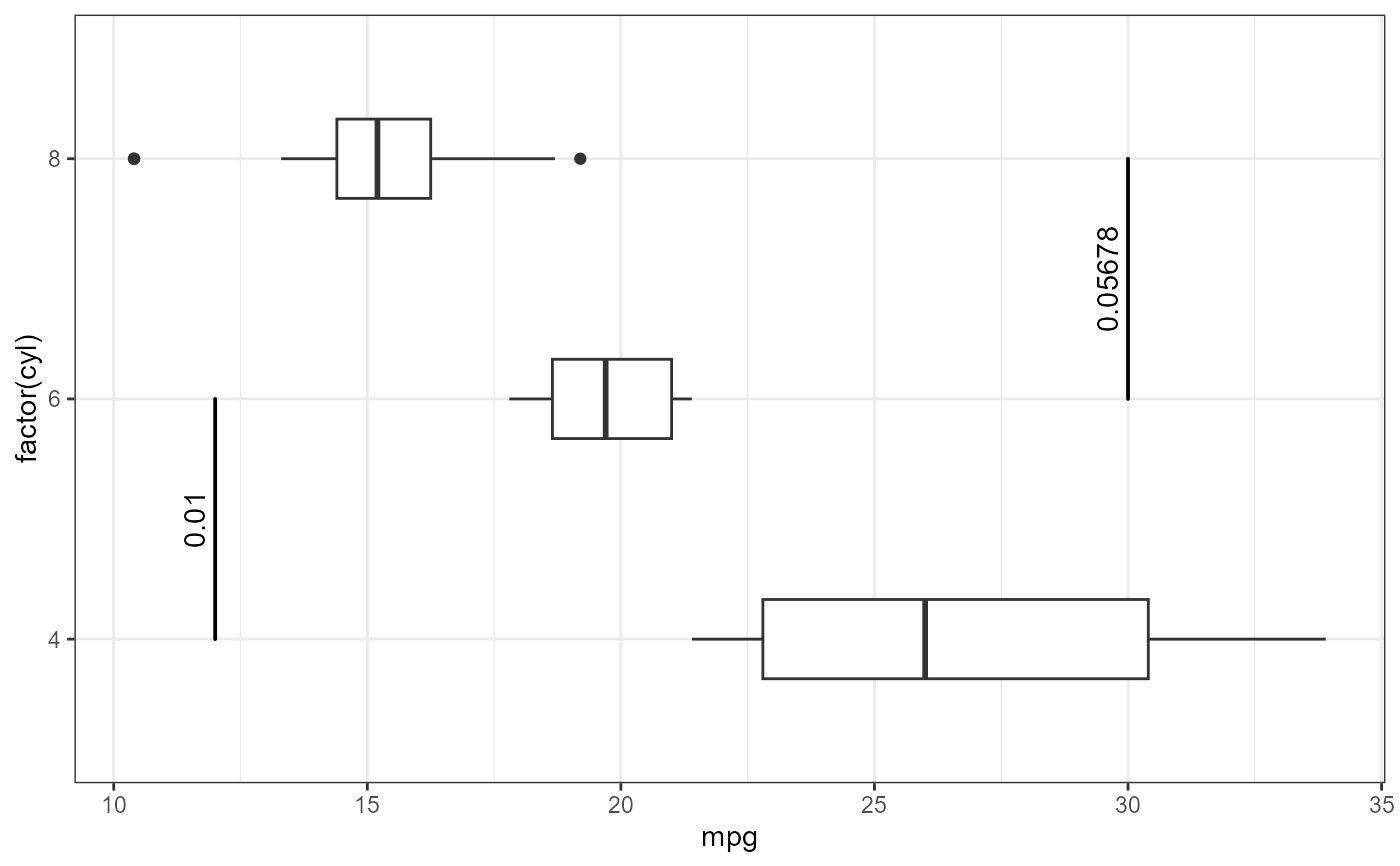
p3 +
geom_text_pairwise(data = my.pairs,
aes(ymin = A, ymax = B,
x = bar.height,
label = p.value))
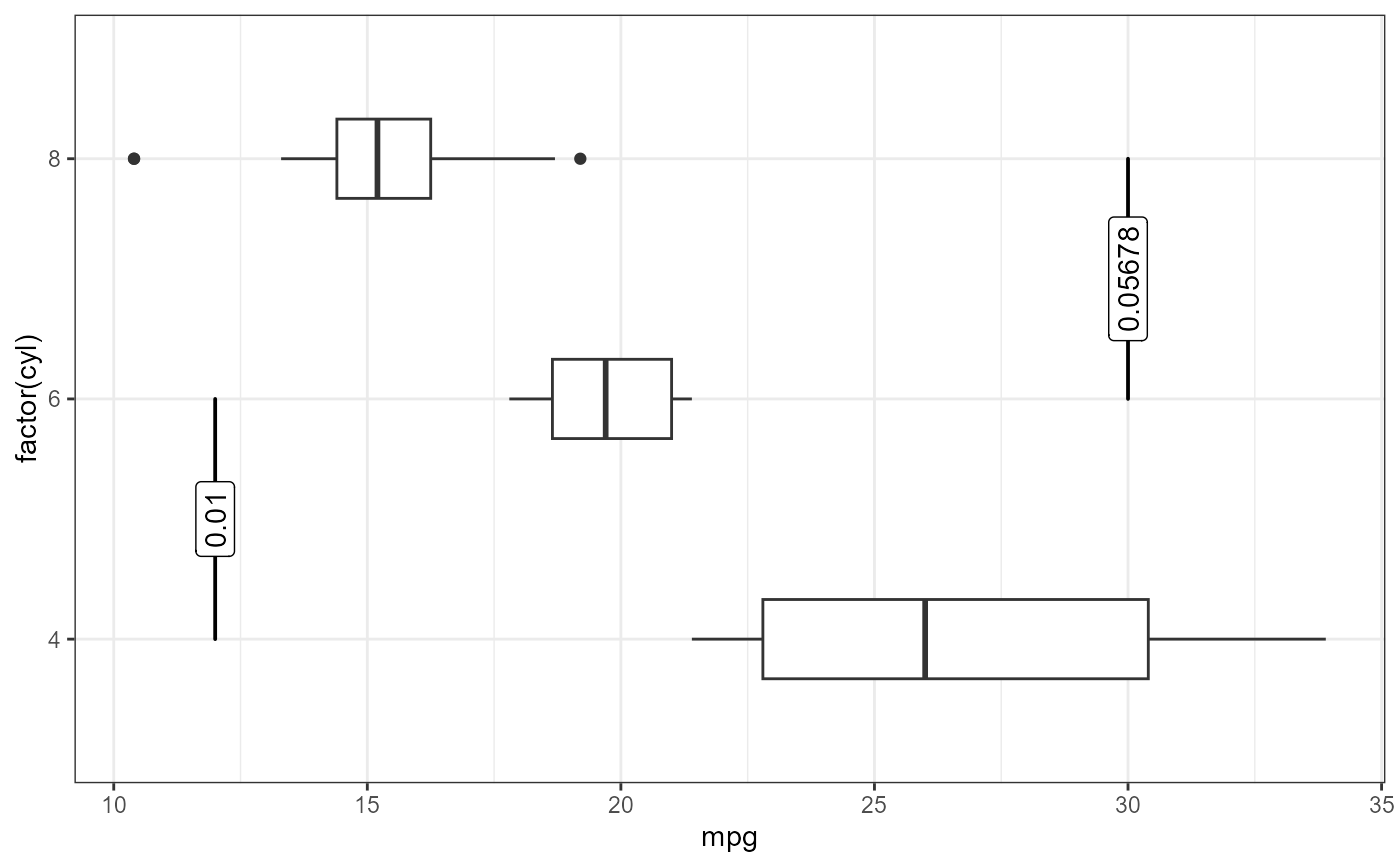
 p3 +
geom_label_pairwise(data = my.pairs,
aes(ymin = A, ymax = B,
x = bar.height,
label = p.value))
p3 +
geom_label_pairwise(data = my.pairs,
aes(ymin = A, ymax = B,
x = bar.height,
label = p.value))