Kumpula examples
Pedro J. Aphalo
2023-01-17
Source:vignettes/kumpula_examples.Rmd
kumpula_examples.RmdIntroduction
The FMI WPS API has limts to the amount of data that can be downloaded per query. In addtion if we need to frequently retrieve fresh data from the same station or group of stations we can retrieve the missing data and append it to those previosuly downloaded instead of fetching mostly the same data each time.
Set up
library(fmi2)
library(dplyr)
#>
#> Attaching package: 'dplyr'
#> The following objects are masked from 'package:stats':
#>
#>     filter, lag
#> The following objects are masked from 'package:base':
#>
#>     intersect, setdiff, setequal, union
library(sf)
#> Linking to GEOS 3.9.3, GDAL 3.5.2, PROJ 8.2.1; sf_use_s2() is TRUE
library(lubridate)
#> Loading required package: timechange
#>
#> Attaching package: 'lubridate'
#> The following objects are masked from 'package:base':
#>
#>     date, intersect, setdiff, union
library(ggplot2)
library(ggpmisc)
#> Loading required package: ggpp
#>
#> Attaching package: 'ggpp'
#> The following object is masked from 'package:ggplot2':
#>
#>     annotate
We can query by FMI station ID, for simplicity we set it here.
# ID code of the station from where we fetch data
stn_fmisid <- 101004 # Kumpula, change as needed
starttime.char <- "2022-12-31 22:00" # UTC midnight in Finland
We can query information about the station.
Downloading hourly data values
We store data locally in a file and if the file exists load and append to it the missing data from its end and now. We need to be careful with time zones!! It is simplest to use UTC for the data and only change the time zone for plotting.
if (!file.exists("fmi-weather-data-wide.Rda")) {
  # Used only once or when replacing all data
  starttime <- ymd_hm(starttime.char, tz = "UTC")
  wide_weather_data <- data.frame()
} else {
  load("fmi-weather-data-wide.Rda")
  # we start 59 min after end of previously downloaded data
  starttime <-force_tz(max(wide_weather_data$time), tzone = "UTC") + minutes(59)
}

endtime <- trunc(now(), units = "mins")
  # we read the new data to a new dataframe
  # (to avoid appending repeatedly to a long one)
  new_wide_data <- data.frame()
  while (starttime < endtime) {
    sliceendtime <- starttime + days(28) # keep query size at max of 4 weeks
    if (sliceendtime > endtime) {
      sliceendtime <- endtime
    }
    kumpula_data <- obs_weather_hourly(starttime = as.character(starttime),
                                       endtime = as.character(sliceendtime),
                                       fmisid = stn_fmisid)

    slice_data <- kumpula_data %>%
      tidyr::spread(variable, value) %>%
      # convert the sf object into a regular tibble
      sf::st_set_geometry(NULL)

    new_wide_data <- rbind(new_wide_data, slice_data)
    starttime <- sliceendtime + minutes(1)
    cat(".")
  }

  range(new_wide_data$time) # freshly read
#> Warning in min(x, na.rm = na.rm): no non-missing arguments to min; returning Inf
#> Warning in max(x, na.rm = na.rm): no non-missing arguments to max; returning
#> -Inf
#> [1]  Inf -Inf

  wide_weather_data <- rbind(wide_weather_data, new_wide_data)
  range(wide_weather_data$time) # all data to be saved
#> [1] "2022-12-31 22:00:00 UTC" "2023-01-17 19:00:00 UTC"
  colnames(wide_weather_data)
#>  [1] "time"           "PA_PT1H_AVG"    "PRA_PT1H_ACC"   "PRI_PT1H_MAX"
#>  [5] "RH_PT1H_AVG"    "TA_PT1H_AVG"    "TA_PT1H_MAX"    "TA_PT1H_MIN"
#>  [9] "WAWA_PT1H_RANK" "WD_PT1H_AVG"    "WS_PT1H_AVG"    "WS_PT1H_MAX"
#> [13] "WS_PT1H_MIN"

  save(wide_weather_data, file = "fmi-weather-data-wide.Rda")
The description of the variables can be obtained from the server.
fmi2::describe_variables(colnames(wide_weather_data)[-1])
#> # A tibble: 12 × 6
#> variable label base_p…¹ unit stat_…² agg_p…³
#> <chr> <chr> <chr> <chr> <chr> <chr>
#> 1 PA_PT1H_AVG Air pressure Air pre… hPa avg PT1H
#> 2 PRA_PT1H_ACC Precipitation amount Amount … mm acc PT1H
#> 3 PRI_PT1H_MAX Maximum precipitation intensity Amount … mm/h max PT1H
#> 4 RH_PT1H_AVG Relative humidity Humidity % avg PT1H
#> 5 TA_PT1H_AVG Air temperature Tempera… degC avg PT1H
#> 6 TA_PT1H_MAX Highest temperature Tempera… degC max PT1H
#> 7 TA_PT1H_MIN Lowest temperature Tempera… degC min PT1H
#> 8 WAWA_PT1H_RANK Present weather (auto) Weather NA rank PT1H
#> 9 WD_PT1H_AVG Wind direction Wind deg avg PT1H
#> 10 WS_PT1H_AVG Wind speed Wind m/s avg PT1H
#> 11 WS_PT1H_MAX Maximum wind speed Wind m/s max PT1H
#> 12 WS_PT1H_MIN Minimum wind speed Wind m/s min PT1H
#> # … with abbreviated variable names ¹base_phenomenon, ²stat_function,
#> # ³agg_period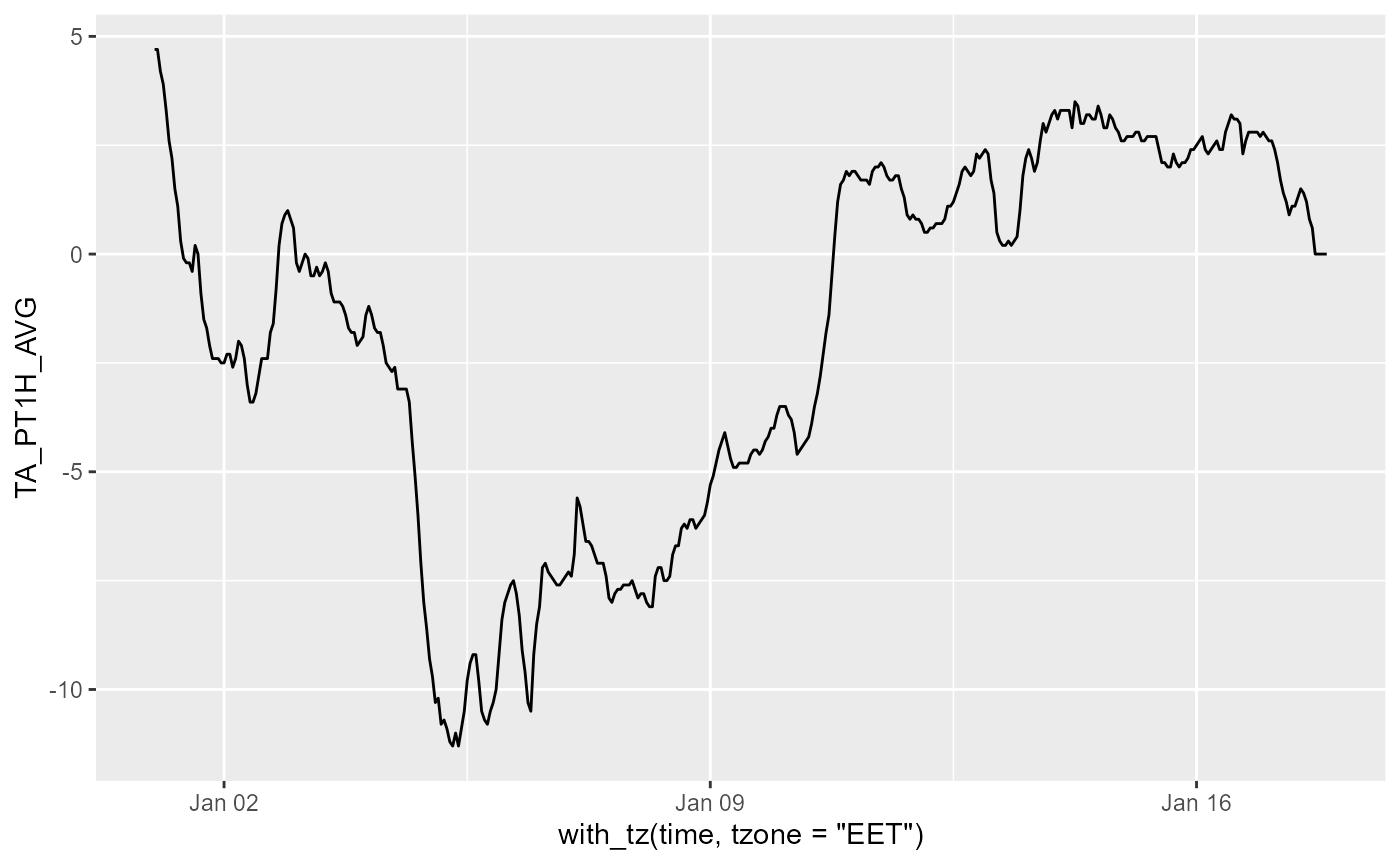
Downloading radiation data at 1 min
The station ID was set above, and we use it again.
if (!file.exists("fmi-sun-data-wide.Rda")) {
  # Used only once or when replacing all data
  starttime.char <- "2023-01-15 22:00"  # UTC at midnight in Finland
  starttime <- ymd_hm(starttime.char)
  wide_sun_data <- data.frame()
} else {
  load("fmi-sun-data-wide.Rda")
  # we start 1 h after end of previously downloaded data
  starttime <- max(wide_sun_data$time) + minutes(1) + hours(2) # convert to UTC + 2h
}

endtime <- trunc(now(), units = "mins")
# we read the new data to a new dataframe
# (to avoid appending repeatedly to a long one)
new_wide_data <- data.frame()
while (starttime < endtime) {
  sliceendtime <- starttime + days(7) # keep query size at max of 1 week
  if (sliceendtime > endtime) {
    sliceendtime <- endtime
  }
  kumpula_data <- obs_radiation_minute(starttime = as.character(starttime),
                                       endtime = as.character(sliceendtime),
                                       fmisid = 101004)

  slice_data <- kumpula_data %>%
    tidyr::spread(variable, value) %>%
    # convert the sf object into a regular tibble
    sf::st_set_geometry(NULL)

  new_wide_data <- rbind(new_wide_data, slice_data)
  starttime <- sliceendtime + minutes(1)
  cat(".")
}

range(new_wide_data$time)
#> Warning in min(x, na.rm = na.rm): no non-missing arguments to min; returning Inf
#> Warning in max(x, na.rm = na.rm): no non-missing arguments to max; returning
#> -Inf
#> [1]  Inf -Inf

wide_sun_data <- rbind(wide_sun_data, new_wide_data)
range(wide_sun_data$time)
#> [1] "2023-01-15 22:00:00 UTC" "2023-01-17 19:08:00 UTC"
colnames(wide_sun_data)
#>  [1] "time"       "DIFF_1MIN"  "DIR_1MIN"   "GLOB_1MIN"  "LWIN_1MIN"
#>  [6] "LWOUT_1MIN" "NET_1MIN"   "REFL_1MIN"  "SUND_1MIN"  "UVB_U"

save(wide_sun_data, file = "fmi-sun-data-wide.Rda")
fmi2::describe_variables(colnames(wide_sun_data)[-1])
#> # A tibble: 9 × 6
#> variable label base_p…¹ unit stat_…² agg_p…³
#> <chr> <chr> <chr> <chr> <chr> <chr>
#> 1 DIFF_1MIN "Diffuse radiation" Solar r… W/m2 avg PT1M
#> 2 DIR_1MIN "Direct solar radiation" Solar r… W/m2 avg PT1M
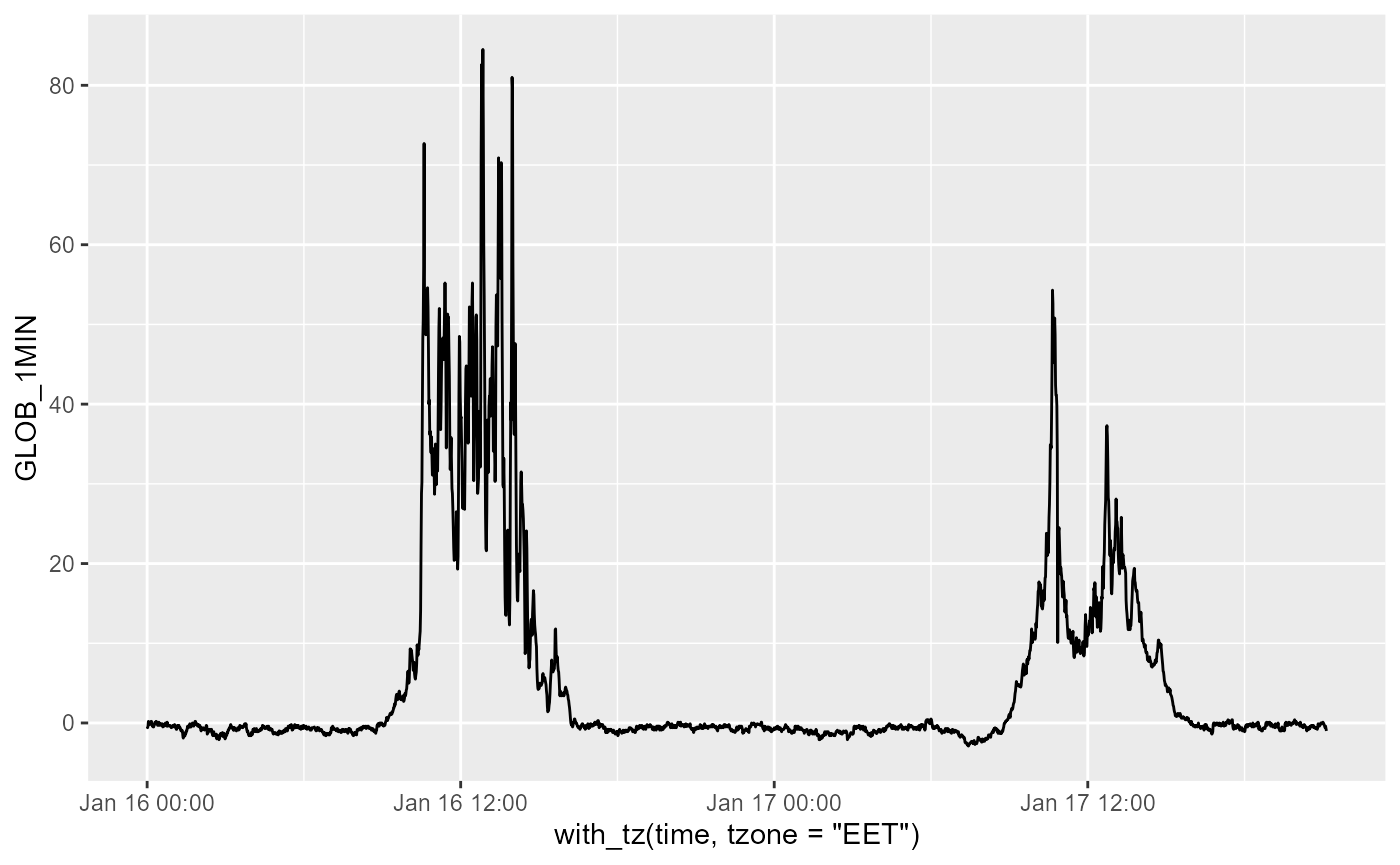
#> 3 GLOB_1MIN "Global radiation" Solar r… W/m2 avg PT1M
#> 4 LWIN_1MIN "Long wave solar radiation " UV radi… W/m2 avg PT1M
#> 5 LWOUT_1MIN "Long wave outgoing solar radiation" UV radi… W/m2 avg PT1M
#> 6 NET_1MIN "Radiation balance" Solar r… W/m2 avg PT1M
#> 7 REFL_1MIN "Reflected radiation" Solar r… W/m2 avg PT1M
#> 8 SUND_1MIN "Sunshine duration" Sunshin… s acc PT1M
#> 9 UVB_U "Ultraviolet irradiance" UV radi… index avg PT1M
#> # … with abbreviated variable names ¹base_phenomenon, ²stat_function,
#> # ³agg_period