photobiologySensors: Response Data for Light Sensors
Source:R/photobiologySensors.r
photobiologySensors-package.RdSpectral response data for broadband ultraviolet and visible radiation sensors. Angular response data for broadband ultraviolet and visible radiation sensors and diffusers used as entrance optics. Data obtained from multiple sources were used: author-supplied data from scientific research papers, sensor-manufacturer supplied data, and published sensor specifications. Part of the 'r4photobiology' suite Aphalo P. J. (2015) doi:10.19232/uv4pb.2015.1.14 .
Details
Data for spectral response for different types of broadband sensors are
stored as objects of class sensor_spct as collection members in
an object of class sensor_mspct.
In addition to the spectra the package provides character vectors of names
to be used as indexes to extract spectra from the collection.
Data for angular response for different types of broadband sensors and some
diffusers used as entrance optics for spectrometers are stored as objects
of class data.frame as members of a list.
In addition to the list of data frames, the package provides character vectors of names
to be used as indexes to extract the data frames from the named list.
The data in this package are not original. Some have been provided by authors of scientific publications and manufacturers. However, most of the spectra have been digitized from manufacturer's brochures and manuals available on web sites.
Warning!
The spectral data included in this package are not all based on supplier's specifications and are only for information. The exact response spectrum depends to some extent on testing conditions, but more importantly varies among individual sensor units. Spectral specifications are usually given as typical values. All the sensors for which data are presented here need periodic calibration. In other words, the data provided here are not a substitute for actual calibration under measuring conditions for each individual sensor unit. For less demanding situations like roughly assessing the suitability of sensors or the need or not of a transfer calibration, the data are good enough. They can be especially useful in teaching.
Data and their units of expression
Data are normalized to one at the wavelength of maximum response to energy. Wavelengths are expressed in nanometres as required by the classes from package 'photobiology' used to store the data. The User Guide shows how to re-scale and normalize the data using other criteria.
References
Aphalo, Pedro J. (2015) The r4photobiology suite. UV4Plants Bulletin, 2015:1, 21-29. doi:10.19232/uv4pb.2015.1.14 .
Author
Maintainer: Pedro J. Aphalo pedro.aphalo@helsinki.fi (ORCID)
Authors:
Pedro J. Aphalo pedro.aphalo@helsinki.fi (ORCID)
Examples
library(photobiology)
library(photobiologyWavebands)
library(ggspectra)
#> Loading required package: ggplot2
names(sensors.mspct)
#> [1] "ams_AS7263" "ams_AS7331"
#> [3] "ams_AS7341" "ams_AS7343"
#> [5] "ams_TSL254R" "ams_TSL257"
#> [7] "ams_TSL2591" "AnalytikJena_UVX25"
#> [9] "AnalytikJena_UVX31" "AnalytikJena_UVX36"
#> [11] "apogee_s2_131_FR" "apogee_s2_131_R"
#> [13] "apogee_sq_100X" "apogee_sq_500"
#> [15] "apogee_sq_610" "apogee_su_200"
#> [17] "Berger_UV_Biometer" "DeltaT_BF5"
#> [19] "flat_e" "flat_q"
#> [21] "Hamamatsu_G17191" "Hamamatsu_G17193"
#> [23] "Hamamatsu_G6262" "Hamamatsu_R16571"
#> [25] "Hamamatsu_S1226_BQ" "Irradian_DA211A_Cos"
#> [27] "Irradian_DA211B2_Cos" "Irradian_DV211E_Cos"
#> [29] "Irradian_DV211Q_Cos" "KIPP_CM21"
#> [31] "KIPP_CUV_5" "KIPP_PQS1"
#> [33] "KIPP_UVS_A" "KIPP_UVS_B"
#> [35] "KIPP_UVS_E" "LICOR_LI_190"
#> [37] "LICOR_LI_190R" "LICOR_LI_190SA"
#> [39] "LICOR_LI_200" "LICOR_LI_210"
#> [41] "LICOR_LI_210R" "LiteOn_LTR390"
#> [43] "Osram_BPX65" "sglux_custom_green"
#> [45] "sglux_custom_UVA1" "sglux_SG01D_A"
#> [47] "sglux_SG01D_B" "sglux_SG01D_C"
#> [49] "sglux_SG01L" "sglux_TOCON_blue4"
#> [51] "Skye_SKE510" "Skye_SKL310"
#> [53] "Skye_SKP210" "Skye_SKP215"
#> [55] "Skye_SKR110_FR" "Skye_SKR110_R"
#> [57] "Skye_SKS1110" "Skye_SKU421"
#> [59] "Skye_SKU421a" "Skye_SKU430a"
#> [61] "Skye_SKU440a" "SolarLight_501_Biometer_high_UVA"
#> [63] "SolarLight_501_Biometer_low_UVA" "SolarLight_501_Biometer_typical"
#> [65] "Solarmeter_SM60" "Specmeters_3415F"
#> [67] "Thies_E1c" "Vishay_VEML6075"
#> [69] "Vital_BW_20"
licor_sensors
#> [1] "LICOR_LI_190" "LICOR_LI_190R" "LICOR_LI_190SA" "LICOR_LI_200"
#> [5] "LICOR_LI_210" "LICOR_LI_210R"
par_sensors
#> [1] "apogee_sq_500" "Skye_SKP215" "Skye_SKE510"
#> [4] "Skye_SKP210" "KIPP_PQS1" "LICOR_LI_190"
#> [7] "DeltaT_BF5" "Specmeters_3415F" "Irradian_DV211Q_Cos"
intersect(par_sensors, licor_sensors)
#> [1] "LICOR_LI_190"
photon_as_default()
response(sensors.mspct$LICOR_LI_190R, w.band = PAR(), quantity = "contribution.pc")
#> Warning: Using only wavelength range for effective waveband(s)
#> Warning: The spectral data have been normalized, preventing calculation of irradiance. See 'setNormalised()' and 'normalise()'.
#> R/Rtot[/q]_range.400.700
#> NA
#> attr(,"time.unit")
#> [1] "second"
#> attr(,"radiation.unit")
#> [1] "contribution.pc photon response"
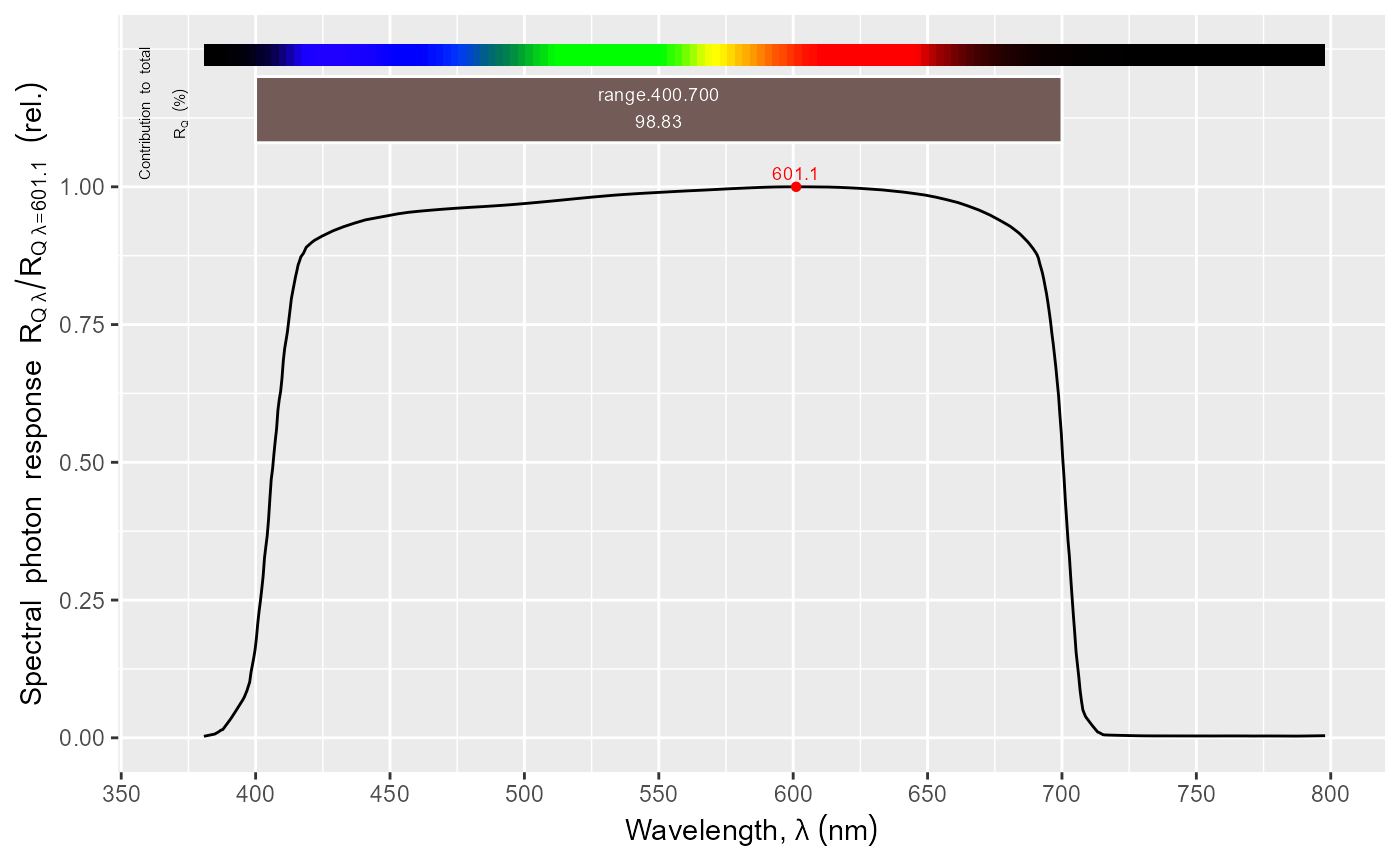
autoplot(sensors.mspct$LICOR_LI_190R, w.band = PAR(), label.qty = "contribution.pc")
#> Warning: BSWFs not supported by summary: using wavelength range for PAR'.
 names(diffusers.lst)
#> [1] "ams_TSL254R" "ams_TSL257" "analytik_jena_cosine"
#> [4] "bentham_D7" "bentham_D7_dome" "ideal_cosine"
#> [7] "ideal_dome" "ideal_sphere" "licor_R"
#> [10] "ocean_optics_4mm" "schreder_J1002" "Scintec"
#> [13] "sglux_TOCON" "sglux_uv_cosine" "sglux_uvi_cosine"
#> [16] "Solarlight_501" "vishay_VEML6075" "vital_BW20"
cosine_diffusers
#> [1] "ams_TSL254R" "ams_TSL257" "analytik_jena_cosine"
#> [4] "bentham_D7" "ideal_cosine" "ideal_sphere"
#> [7] "licor_R" "ocean_optics_4mm" "schreder_J1002"
#> [10] "Scintec" "sglux_TOCON" "sglux_uv_cosine"
#> [13] "sglux_uvi_cosine" "Solarlight_501" "vishay_VEML6075"
#> [16] "vital_BW20"
names(diffusers.lst)
#> [1] "ams_TSL254R" "ams_TSL257" "analytik_jena_cosine"
#> [4] "bentham_D7" "bentham_D7_dome" "ideal_cosine"
#> [7] "ideal_dome" "ideal_sphere" "licor_R"
#> [10] "ocean_optics_4mm" "schreder_J1002" "Scintec"
#> [13] "sglux_TOCON" "sglux_uv_cosine" "sglux_uvi_cosine"
#> [16] "Solarlight_501" "vishay_VEML6075" "vital_BW20"
cosine_diffusers
#> [1] "ams_TSL254R" "ams_TSL257" "analytik_jena_cosine"
#> [4] "bentham_D7" "ideal_cosine" "ideal_sphere"
#> [7] "licor_R" "ocean_optics_4mm" "schreder_J1002"
#> [10] "Scintec" "sglux_TOCON" "sglux_uv_cosine"
#> [13] "sglux_uvi_cosine" "Solarlight_501" "vishay_VEML6075"
#> [16] "vital_BW20"