Assemble model-fit-derived text or expressions and map them to
the label aesthetic.
Usage
use_label(..., labels = NULL, other.mapping = NULL, sep = "*\", \"*")

f_use_label(..., labels = NULL, other.mapping = NULL, format = NULL)
Arguments
- ...
character Strings giving the names of at most six label components in the order they will be included in the combined label.
- labels
character A vector with the name of at most six label components. If provided, values passed through
...are ignored.- other.mapping
An unevaluated expression constructed with function
aes()to be included in the returned value.- sep
character A string used as separator when pasting the label components together.
- format
character A string with as many labels being mapped. The format string must have mark-up matching the
output.typeused! With the default geometries,output.type = "expression"requiring that the character string can
Value
A mapping to the label aesthetic and optionally additional
mappings as an unevaluated R expression, built using function
aes(), ready to be passed as argument to the
mapping parameter of the supported statistics.
Details
Statistics stat_poly_eq(), stat_ma_eq(),
stat_quant_eq(), stat_distrmix_eq() and
stat_correlation() return multiple text strings to be used
individually or assembled into longer character strings depending on the
labels actually desired. Assembling and mapping them requires verbose R
code and familiarity with the syntax of the markup language used, by
default R plotmath expression syntax. Function
use_label() automates these two tasks and accepts abbreviated
familiar names for the parameters in addition to the name of the columns in
the data object returned by the statistics. The default separator is
suitable for plotmath expressions.
These four statistics return several character variables with names
ending in .label. This ending can be omitted, as well as
.value for f.value.label, t.value.label,
z.value.label, S.value.label and p.value.label.
R2 can be used in place of rr. Furthermore, case is ignored.
Thus, use_label("eq", "R2") is equivalent to
aes(label = paste(after_stat(eq.label), after_stat(rr.label),
  sep = "*\", \"*"))
.
Function use_label() calls aes() to create a mapping for
the label aesthetic to a text string assembled by calling
paste(). Function f_use_label() uses
sprintf() instead of paste() and expects a format
string with the correct number of place-holders for the strings.
Both functions can, when needed, combine this mapping to the label
aesthetic with other mappings created with aes().
**When the number of labels does not match the number of fields in the
format, or the label names do not match the names of variables in
data, errors are triggered when the mapping is constructed, i.e.,
at the time the plot is rendered.**
See also
Functions use_label() and f_use_label() are wrappers
on function aes() and can be used to create
mappings to the label aesthetic. These functions are matched to
statistics for annotations from package 'ggpmisc'. Please,
see their documentation for the formatted character labels they generate.
Please, see the articles at online-only documentation for additional use examples and guidance.
Examples
# generate artificial data
set.seed(4321)
x <- 1:100
y <- (x + x^2 + x^3) + rnorm(length(x), mean = 0, sd = mean(x^3) / 4)
my.data <- data.frame(x = x,
y = y * 1e-5,
group = c("A", "B"),
y2 = y * 1e-5 + c(2, 0))
# give a name to a formula
formula <- y ~ poly(x, 3, raw = TRUE)
# default label constructed by use_label()
ggplot(data = my.data,
mapping = aes(x = x, y = y2, colour = group)) +
geom_point() +
stat_poly_line(formula = formula) +
stat_poly_eq(mapping = use_label(),
formula = formula)
 # user specified label components and default for sep
ggplot(data = my.data,
mapping = aes(x = x, y = y2, colour = group)) +
geom_point() +
stat_poly_line(formula = formula) +
stat_poly_eq(mapping = use_label("eq", "F"),
formula = formula)
# user specified label components and default for sep
ggplot(data = my.data,
mapping = aes(x = x, y = y2, colour = group)) +
geom_point() +
stat_poly_line(formula = formula) +
stat_poly_eq(mapping = use_label("eq", "F"),
formula = formula)
 # user specified label components and separator
ggplot(data = my.data,
mapping = aes(x = x, y = y2, colour = group)) +
geom_point() +
stat_poly_line(formula = formula) +
stat_poly_eq(mapping = use_label("R2", "F", sep = "*\" with \"*"),
formula = formula)
# user specified label components and separator
ggplot(data = my.data,
mapping = aes(x = x, y = y2, colour = group)) +
geom_point() +
stat_poly_line(formula = formula) +
stat_poly_eq(mapping = use_label("R2", "F", sep = "*\" with \"*"),
formula = formula)
 # user specified label components and format string
ggplot(data = my.data,
mapping = aes(x = x, y = y2, colour = group)) +
geom_point() +
stat_poly_line(formula = formula) +
stat_poly_eq(mapping =
f_use_label("R2", "F",
format = "\"Estimates: \"*%s*\" with \"*%s*\" works!\""),
formula = formula)
# user specified label components and format string
ggplot(data = my.data,
mapping = aes(x = x, y = y2, colour = group)) +
geom_point() +
stat_poly_line(formula = formula) +
stat_poly_eq(mapping =
f_use_label("R2", "F",
format = "\"Estimates: \"*%s*\" with \"*%s*\" works!\""),
formula = formula)
 # combine the mapping to the label aesthetic with other mappings
ggplot(data = my.data,
mapping = aes(x = x, y = y2)) +
geom_point(mapping = aes(colour = group)) +
stat_poly_line(mapping = aes(colour = group), formula = formula) +
stat_poly_eq(mapping = use_label("grp", "eq", "F",
aes(grp.label = group)),
formula = formula)
# combine the mapping to the label aesthetic with other mappings
ggplot(data = my.data,
mapping = aes(x = x, y = y2)) +
geom_point(mapping = aes(colour = group)) +
stat_poly_line(mapping = aes(colour = group), formula = formula) +
stat_poly_eq(mapping = use_label("grp", "eq", "F",
aes(grp.label = group)),
formula = formula)
 # combine other mappings with default labels
ggplot(data = my.data,
mapping = aes(x = x, y = y2)) +
geom_point(mapping = aes(colour = group)) +
stat_poly_line(mapping = aes(colour = group), formula = formula) +
stat_poly_eq(mapping = use_label(aes(colour = group)),
formula = formula)
# combine other mappings with default labels
ggplot(data = my.data,
mapping = aes(x = x, y = y2)) +
geom_point(mapping = aes(colour = group)) +
stat_poly_line(mapping = aes(colour = group), formula = formula) +
stat_poly_eq(mapping = use_label(aes(colour = group)),
formula = formula)
 # example with other available components
ggplot(data = my.data,
mapping = aes(x = x, y = y2, colour = group)) +
geom_point() +
stat_poly_line(formula = formula) +
stat_poly_eq(mapping = use_label("eq", "adj.R2", "n"),
formula = formula)
# example with other available components
ggplot(data = my.data,
mapping = aes(x = x, y = y2, colour = group)) +
geom_point() +
stat_poly_line(formula = formula) +
stat_poly_eq(mapping = use_label("eq", "adj.R2", "n"),
formula = formula)
 # multiple labels
ggplot(data = my.data,
mapping = aes(x, y2, colour = group)) +
geom_point() +
stat_poly_line(formula = formula) +
stat_poly_eq(mapping = use_label("R2", "F", "P", "AIC", "BIC"),
formula = formula) +
stat_poly_eq(mapping = use_label(c("eq", "n")),
formula = formula,
label.y = "bottom",
label.x = "right")
# multiple labels
ggplot(data = my.data,
mapping = aes(x, y2, colour = group)) +
geom_point() +
stat_poly_line(formula = formula) +
stat_poly_eq(mapping = use_label("R2", "F", "P", "AIC", "BIC"),
formula = formula) +
stat_poly_eq(mapping = use_label(c("eq", "n")),
formula = formula,
label.y = "bottom",
label.x = "right")
 # quantile regression
ggplot(data = my.data,
mapping = aes(x, y)) +
stat_quant_band(formula = formula) +
stat_quant_eq(mapping = use_label("eq", "n"),
formula = formula) +
geom_point()
# quantile regression
ggplot(data = my.data,
mapping = aes(x, y)) +
stat_quant_band(formula = formula) +
stat_quant_eq(mapping = use_label("eq", "n"),
formula = formula) +
geom_point()
 # major axis regression
ggplot(data = my.data, aes(x = x, y = y)) +
stat_ma_line() +
stat_ma_eq(mapping = use_label("eq", "n")) +
geom_point()
# major axis regression
ggplot(data = my.data, aes(x = x, y = y)) +
stat_ma_line() +
stat_ma_eq(mapping = use_label("eq", "n")) +
geom_point()
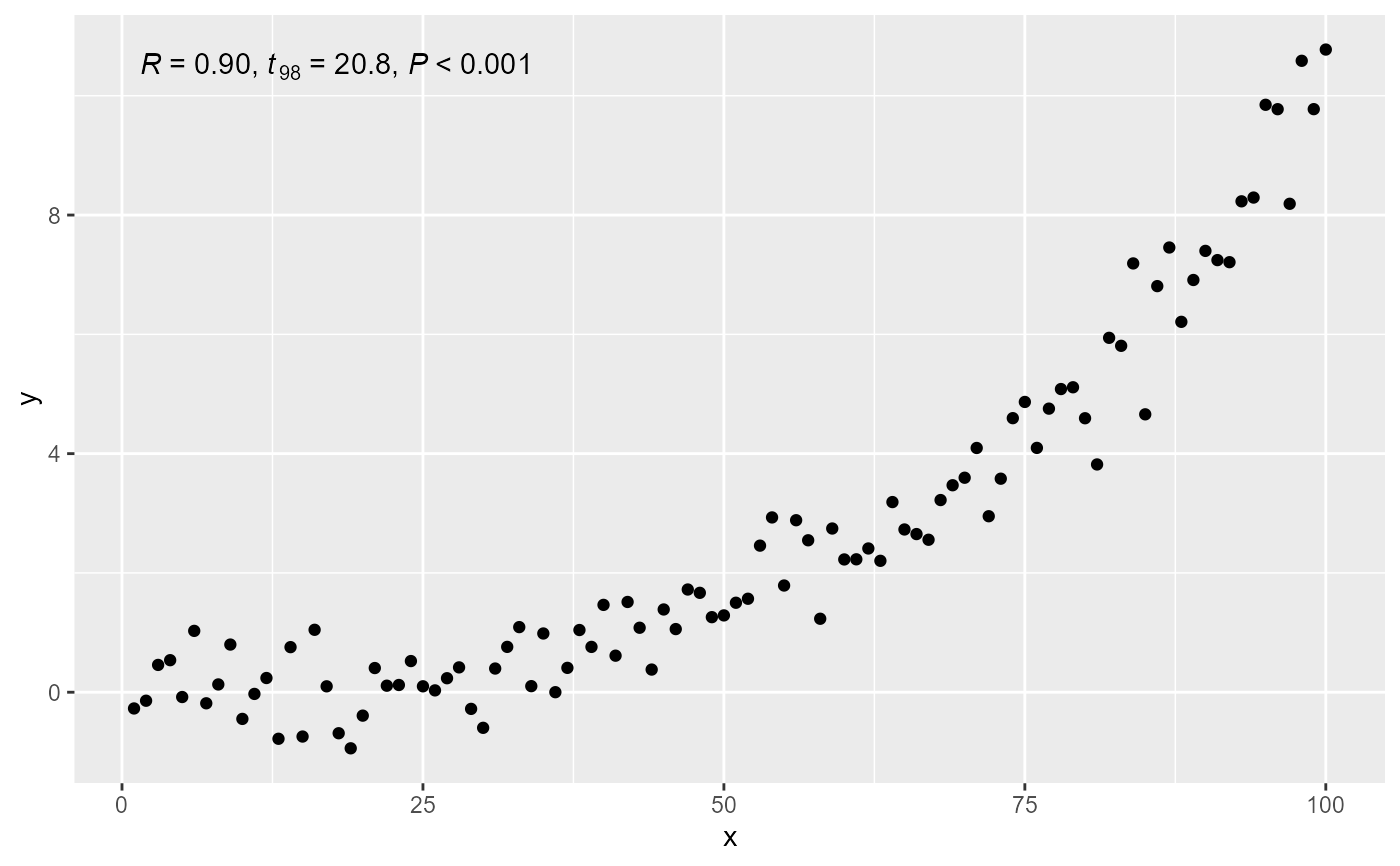
 # correlation
ggplot(data = my.data,
mapping = aes(x = x, y = y)) +
stat_correlation(mapping = use_label("r", "t", "p")) +
geom_point()
# correlation
ggplot(data = my.data,
mapping = aes(x = x, y = y)) +
stat_correlation(mapping = use_label("r", "t", "p")) +
geom_point()